Product Feature Details

Dashboard

Central Hub for Network Insights and Metrics

RPI Performance Insights
Core Dashboard

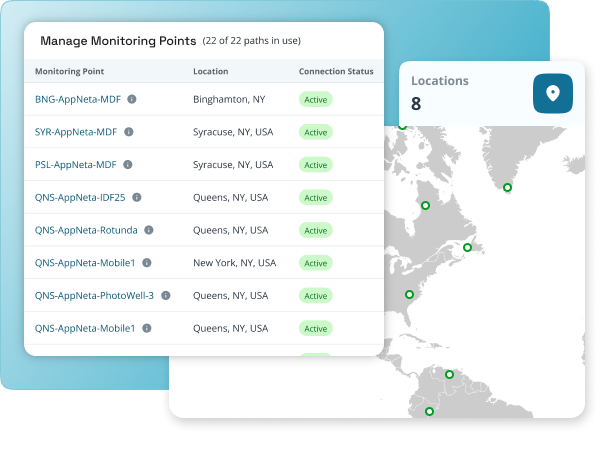
Ensure uninterrupted network performance with instant alerts that notify you the moment any monitoring point goes down. Alongside these alerts, you'll receive detailed information on the exact location of the issue, allowing you to swiftly pinpoint and resolve problems before they impact your operations.

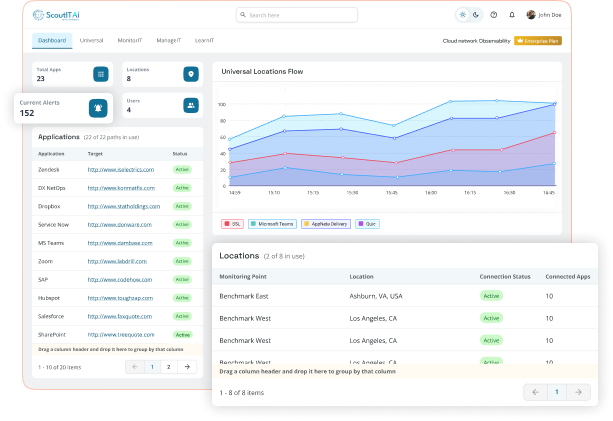
Maintain a comprehensive view of your network’s overall health with an up-to-date summary that includes the number of active alerts and ScoutITAi users. This holistic perspective empowers you to manage your network efficiently, ensuring optimal performance and user satisfaction.

Monitoring Analytics
Monitoring Stats

The Monitoring Stats dashboard gives you insight into the Latency, Data loss values and Data Jitter values of all your applications from each individual monitoring point.

You can view live stats by clicking on the blue tile for a specific monitoring point to see real-time monitoring values from the last hour.

The Monitoring Stats dashboard also captures historical data, so you can review performance on a specific date with the help of the date picker.

Instant Alerts
Observability Dashboard

Real-time alerts of network and application-level performance and experience breaches are given by the Observability Dashboard.

The Observability Dashboard provides proactive access to deep dive potential network issues before they impact your operations, providing insights into trends and optimization Period

Beyond Limits, Beyond Expectations

FAQs

The red color indicates that the respective application or location is not active and on the contrary green color indicates that the respective application or location is active.

After implementation, you can easily add the application you want to monitor and in about five minutes you would be able to monitor the performance of the application.

The numbers of the left side indicated the data loss percentage and the right side indicate the latency. These are used as the major KPIs of performance indicators.

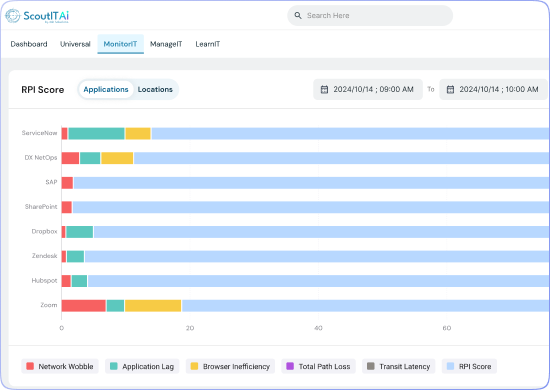
ScoutITAi uses proprietary scoring formulas based on industries we have worked with. The reliability for any given service is calculated in real time to show how resilient that service is to experience.

Yes, according to your ‘number of users’ agreement with A&I.

ScoutIT’s enterprise pack has upgrades that allow users to integrate their own monitoring data and even include it to calculate the reliability score.

Unlike traditional synthetic monitors, ScoutITAi uses both active and passive network monitoring to create synthetic traffic for any given service path. Therefore, ScoutIT can marry network performance with application performance in real-time.

You can configure alerts by creating Alert Global Policy. Alert can be set on monitoring type Data Loss, Data J itter, and Latency. Set caution and danger threshold for monitoring types. When threshold matched, triggered alerts can be seen on the Manage Alert screen.

Yes, since ScoutITAi utilizes synthetic monitoring, it can follow a network just like your users do.

ScoutITAi uses a synthetic or active monitoring approach rather than a legacy monitoring SNMP approach. This allows ScoutIT to provide performance visibility into any network or web application that your users can reach.


Simplified Analytics Simplified Analytics
Fast Setup Fast Setup
Instant Savings Instant Savings
24x7 Support 24x7 Support