Reliability Path Index
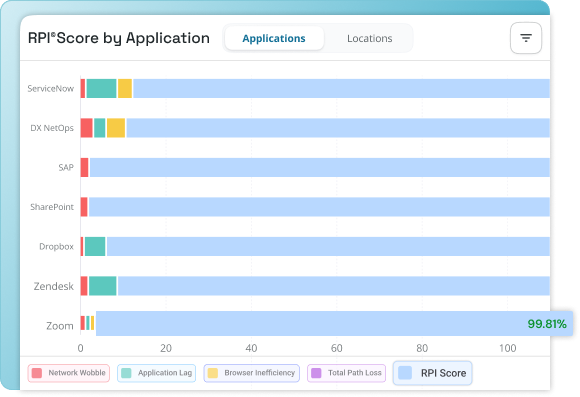
The RPI© is a predictive metric that combines data from 14 key variables to measure and forecast the reliability of IT services.
RPI© uses 15 years of research to analyze past data and predict future IT service reliability, helping prevent issues before they occur.
RPI© pulls data from 14 monitoring domains, including performance, logs, and network stability, to provide a comprehensive reliability score.

Dashboard
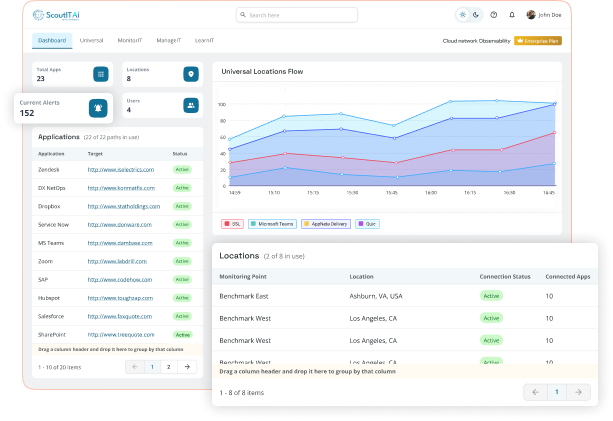
Scout-itAI provides instant alerts and detailed issue locations to quickly resolve problems before they impact operations.
It offers real-time and historical data on latency, data loss, and jitter, enabling efficient network management.
It allows proactive issue detection and trend analysis, helping to optimize network performance and ensure user satisfaction.

Alerts
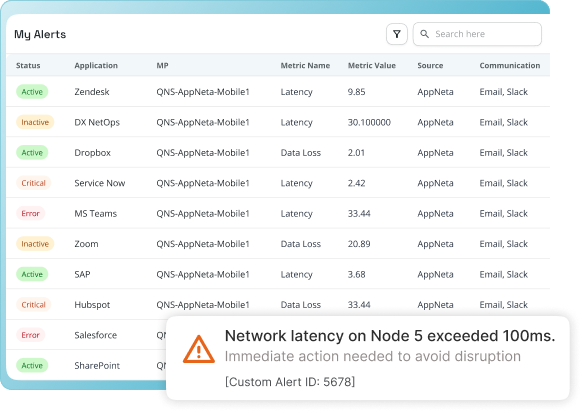
The red color indicates that the respective application or location is not active, while the green color indicates that the respective application or location is active.
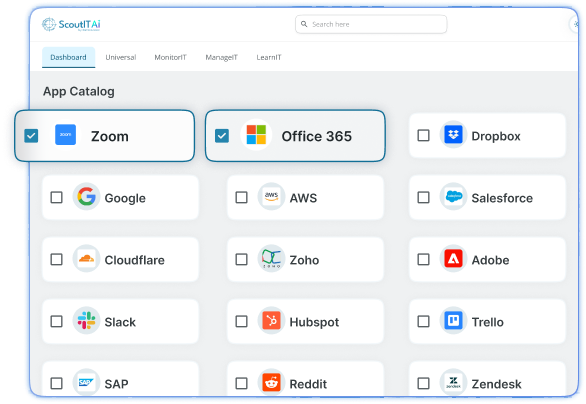
After implementation, you can easily add the application you want to monitor, and within about five minutes, you will be able to monitor the performance of the application.
The numbers on the left side indicate the data loss percentage, while the numbers on the right side indicate the latency. These are the major KPIs of performance indicators.

Application Management
The platform enables quick onboarding and centralized management of all applications, reducing setup time and simplifying administration.
It tracks application health continuously, sends instant alerts on issues, and ensures high performance and user satisfaction.
Role-based permissions allow only authorized users to access or manage applications, protecting sensitive data and improving efficiency.
 Simplified Analytics
 Fast Setup
 Instant Savings
 24x7 Support


 Podcast
 No credit card required
