Dashboard Overview

You can easily view the stats of the applications being monitored using the Dashboards screens. We provide three types of dashboards to deliver high-level insights.

  • Home
  • Monitoring Stats
  • Observability Dashboard

Home

The Home dashboard provides details on active applications and monitoring points that are connected to your account, such as :
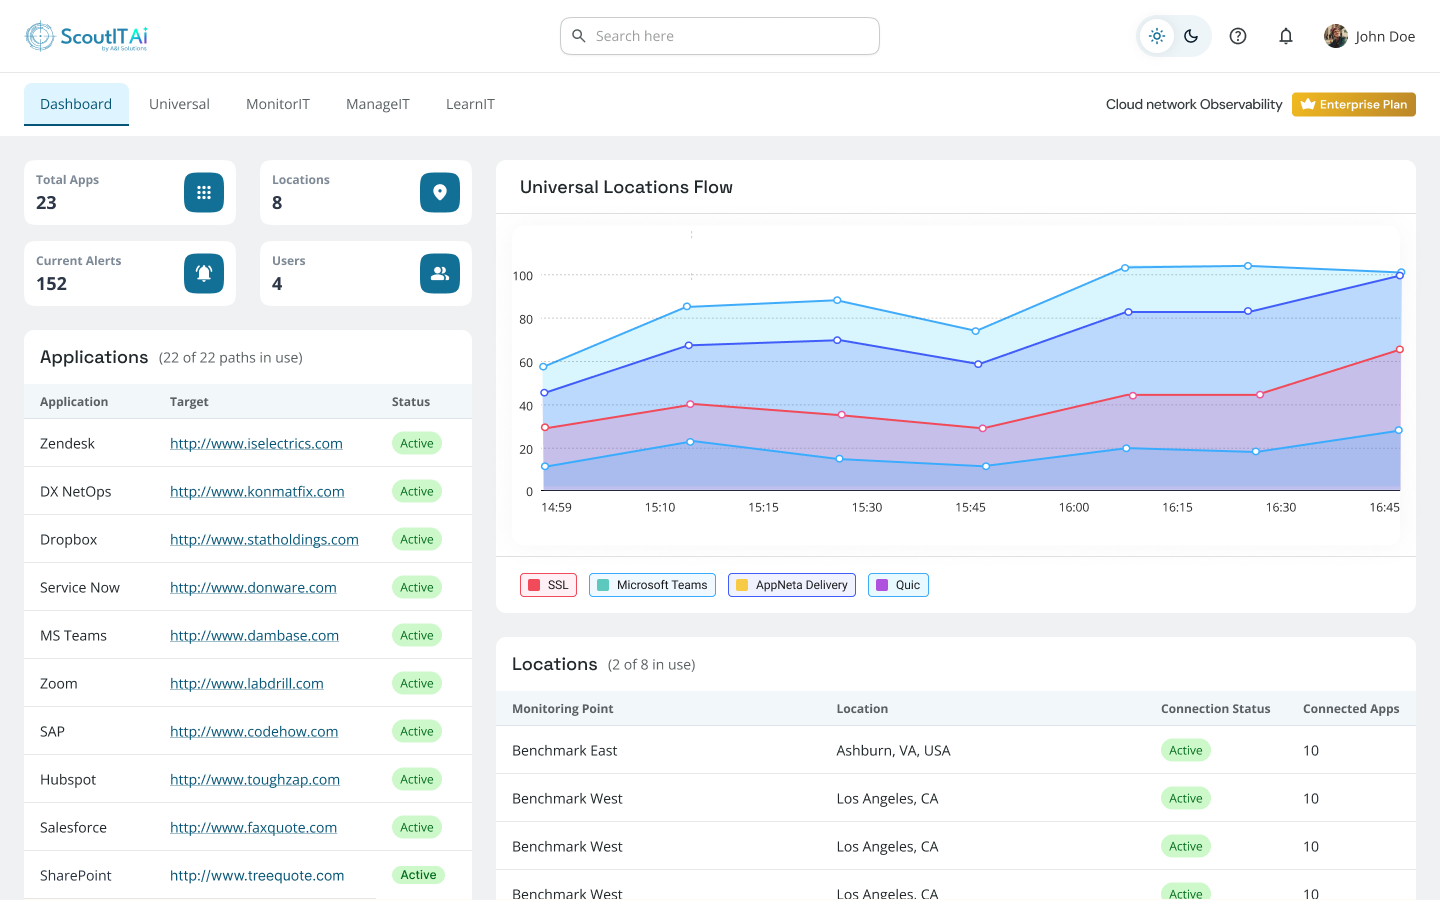
  • If any monitoring points are down.
  • The various locations of the monitoring points.
  • The number of active Applications, Monitoring Points, Alerts, and ScoutITAi Users.
Cloud Network Observability Dashboard - ScoutITAi

Monitoring Stats

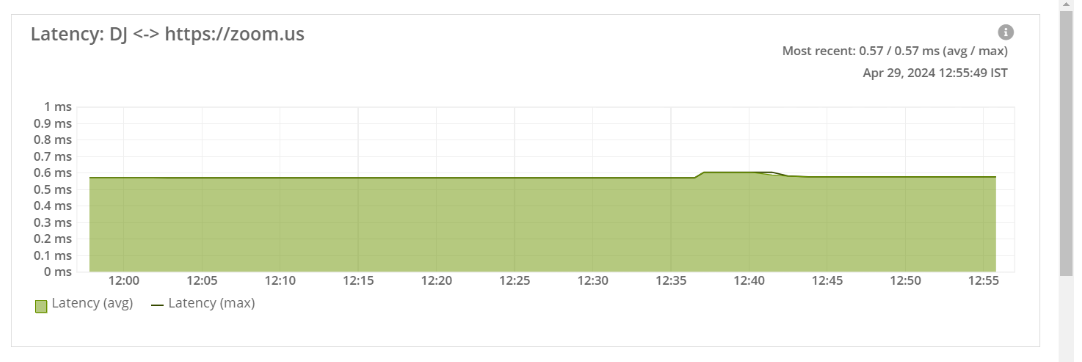
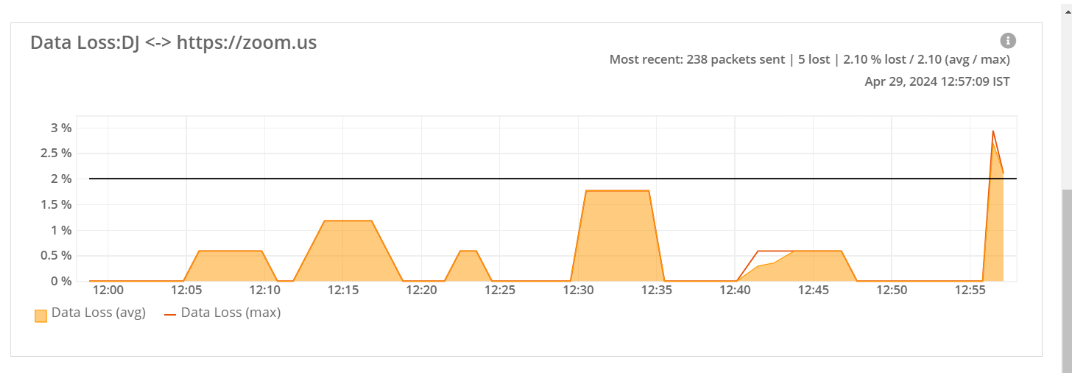
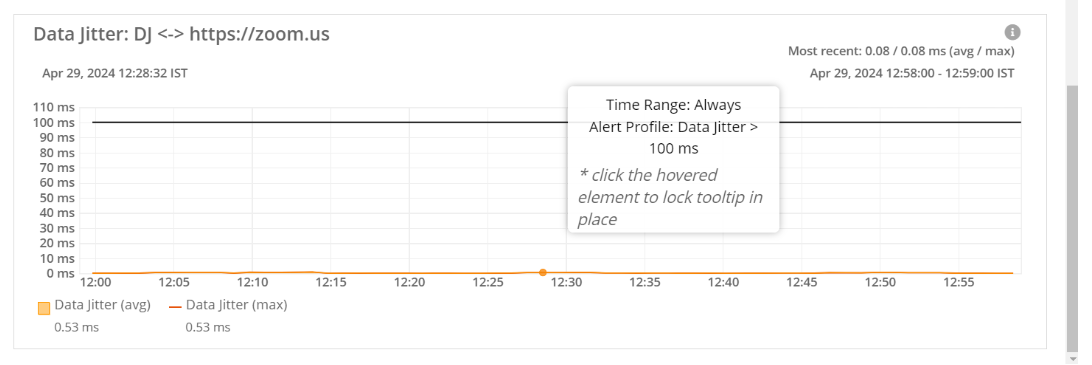
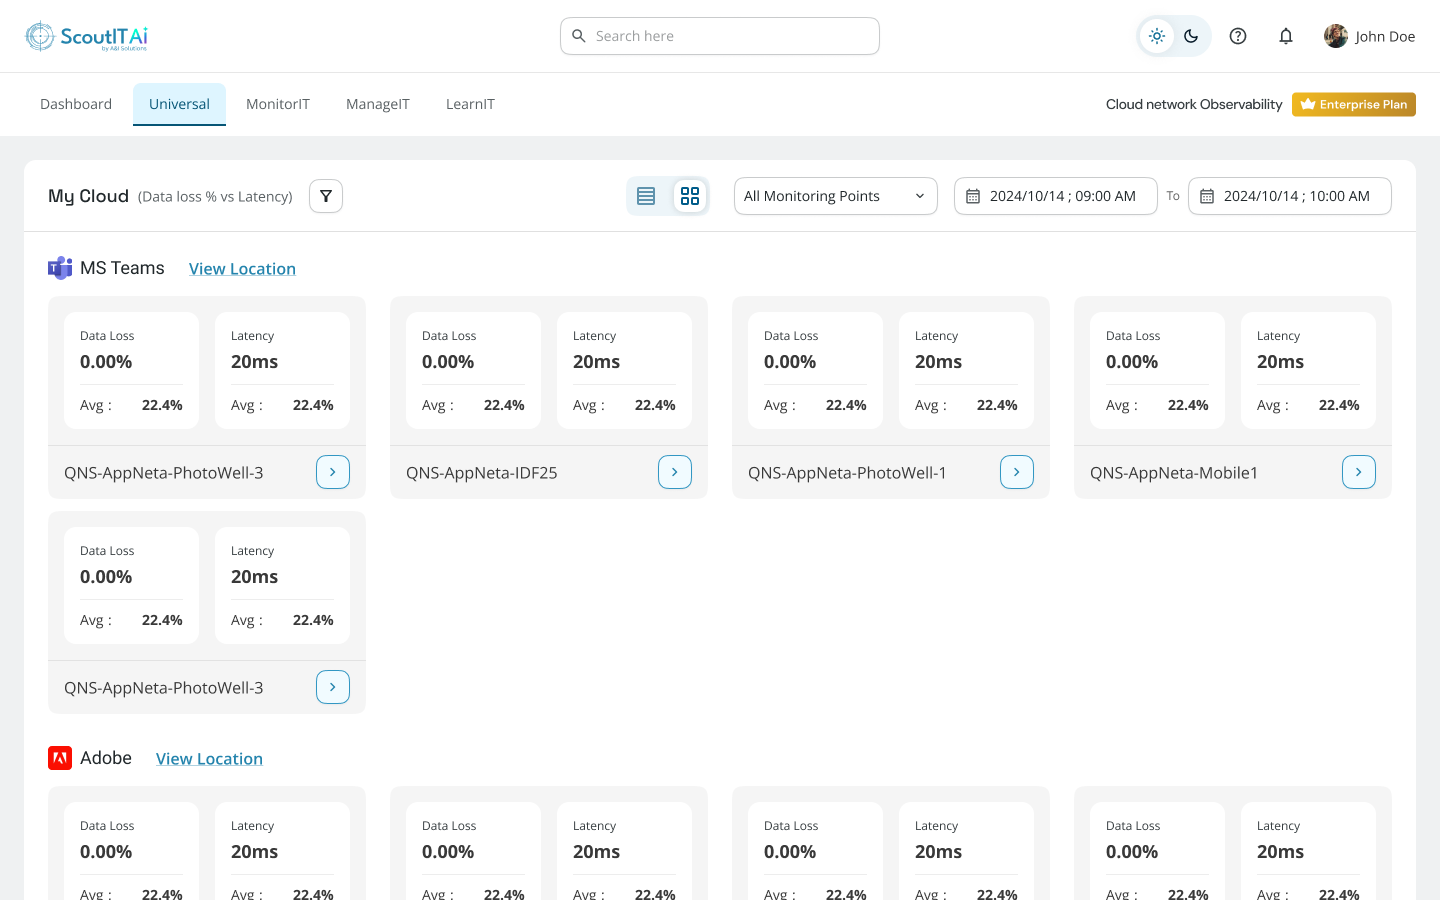
  • The Monitoring Stats dashboard gives you insight into the Latency, Data loss values and Data Jitter values of all your applications from each individual monitoring point.
  • You can view live stats by clicking on the blue tile for a specific monitoring point to see real-time monitoring values from the last hour.
  • The Monitoring Stats dashboard also captures historical data, so you can review performance on a specific date with the help of the date picker.
Cloud Network Observability Dashboard - ScoutITAi

Simplified Analytics Simplified Analytics
Fast Setup Fast Setup
Instant Savings Instant Savings
24x7 Support 24x7 Support